Spatio-temporal patterns
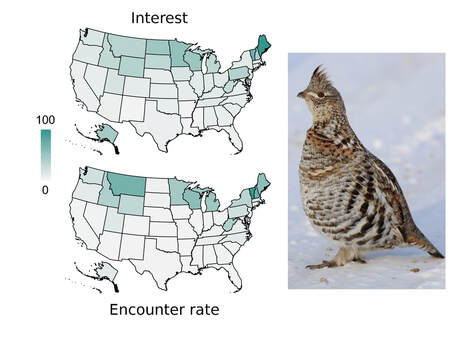 High level of correlation observed for ruffed grouse encounter rate and spatial distribution of societal interest, based on Google Trends [Schuetz & Johnston 2019. PNAS 116:10868-73]; (Photo credit: dfaulder)
Several recent studies highlight the great potential of iEcology. The most common applications of such methods have been to explore species occurrences and their spatio-temporal trends. For example, a study comparing real-world encounter rates of bird species in the USA with Google Trends data found good agreement between the two sources . This showcases the potential of using voluminous search engine data to explore species distributions in many regions. Others have explored species occurrences and distributions using various sources, such as Flickr, news articles, Twitter, YouTube, Facebook, and Google Trends.
Phenological trends
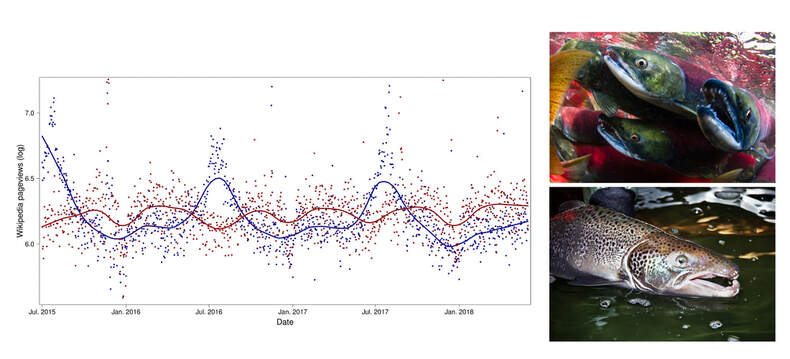 Sockeye salmon (red) and Atlantic salmon (blue) popularity based on Wikipedia pageviews reflects their seasonal migration patterns [Mittermeier et al. 2019. PLoS Biol 17:e3000146]; (Photo credits: Oregon State University, USFWS Northeast Region)
A particular illustration exploring phenology via iEcology comes from assessing seasonal migration patterns of sockeye salmon (Oncorhynchus nerka) and Atlantic salmon (Salmo salar) from Wikipedia pageview frequencies.
Evolutionary dynamics
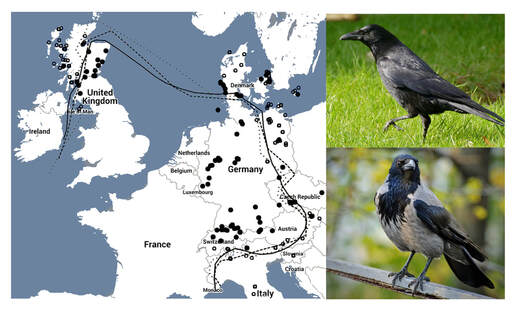 Distribution of carrion and hooded crow in Europe, indicated by Google Images, corresponds well with their actual distribution and hybrid zones [Leighton et al. 2016. Methods Ecol Evol 7:1060-70]; (Photo credits: Bernard Dupont, ponafotkas)
In addition to mapping the distribution and occurrences of known species, images uploaded on social media have also been used to identify new species. Trait dynamics, evolutionary trends, and biogeographic patterns can also be explored using iEcology methods. For instance, Google Images were used to identify the presence and distribution of hybrid zones of hooded (Corvus cornix) and carrion (C. corone) crows in Europe.
Biotic and abiotic interactions
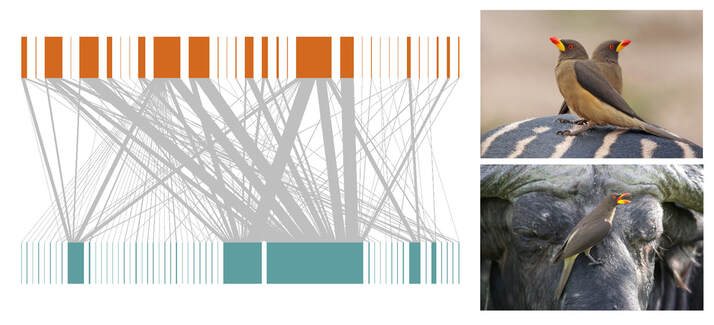 Quantitative bird-mammal association webs for non-oxpecker and oxpecker species in African birds and herbivorous mammals revealed by the analysis of Google Images [Mikula et al. 2018. PeerJ 6:e4520]; (Photo credits: Charles J. Sharp, Derek Keats)
iEcology sources, tools and methods can also be used to explore biotic and abiotic interactions within and across species and their environments. For example, feeding patterns of yellow anaconda (Eunectes notaeus) and green anaconda (E. murinus) were studied using online videos (Miranda et al. 2016), while online images that simultaneously depicted African birds and herbivorous mammals were used to construct a web of associations between these two groups
Behavior
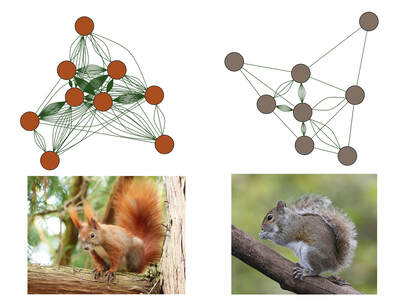 The network visualization of the behavior of red (left) and eastern grey (right) squirrels assessed by YouTube videos [Jagiello et al. 2019. Ecol Inform 51:52-60]]; (Photo credits: Evas-naturfotografie, BirdPhotos)
iEcology also provides new opportunities to study animal behaviour. For instance, YouTube videos have been used to compare the behavior of red (Sciurus vulgaris) and grey squirrels (S. carolinensis) in different habitats. The sheer volume and coverage of such sources could also prove fertile ground for identifying and tracking the spread of new behaviors.
Changes to habitats
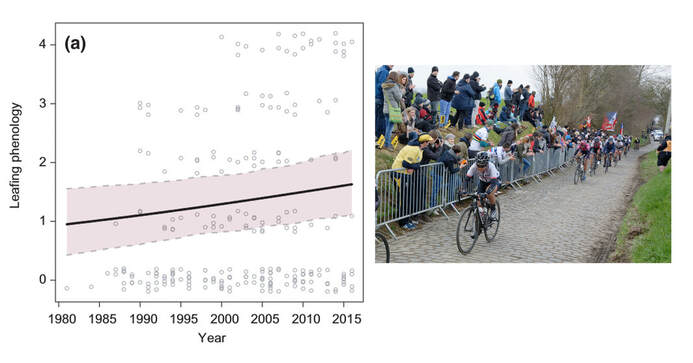 Phenological changes in vegetation as a response to climate change identified through archive videos of the Tour of Flanders cycling race [De Frenne et al. 2018. Methods Ecol Evol 9:1874-1882]; (Photo credit: s.yuki)
iEcology methods have also been used to investigate ecosystem and habitat dynamics in response to increasing anthropogenic impacts. For example, videos of the Tour of Flanders cycling race from over 35 years have been used to track phenological changes to vegetation in response to climate change. Images of corals and tweets referring to corals have both been used to evaluate the state and trends of coral reefs in different areas, suffering from various human impacts. Aspects of invasion dynamics and overexploitation of fish have also been studied using image analysis, tweets, and news articles. Behavioral changes in animals in response to anthropogenic impacts could also be tracked by such methods.
Other opportunities
Many other opportunities are available to use this ever-exapnding data sources to ask basic and applied questions in ecology. For example:
1) Spatio-temporal dynamics of biophysical environments, such as solar radiation and various other climatic parameters were characterized using Flickr tags.
2) Disease ecology, including knowledge of the occurrence, distribution, prevalence and severity of diseases, has also recently benefited from iEcology methods.
3) Functional ecology.
4) Macroecology.
5) Landscape ecology.
6) Urban ecology.
